Sensor Data
Overview
The BlueRange platform is able to automatically collect and store sensor data of various kinds. This sensor data can then be aggregated on a per day, per month or on a custom time span basis. You are able to generate graphs and charts with this data. Additionally, you can subscribe to the corresponding MQTT topics and get a live feed of some of the sensor data.
Sensor Data Publishing
A BlueRange Gateway is usually attached to network of devices such as a BlueRange mesh network that sends sensor data in a format that we call component_sense. This is documented in more detail as part of our BlueRange firmware in the Sensors and Actuators chapter. Sensor data can also be received through our other connectors such as KNX or BACnet.
You need to have a configuration with a Sensors setting applied to each device that should publish its sensor data. Once the gateway receives sensor data from a device, it evaluates the attached sensor configuration. From this mapping, it can compute the final sensor value from the raw data that it receives. It will then publish the data over MQTT.
Sensor Data Historization
The BlueRange Server is subscribed to the MQTT Broker and will store all sensor data that it receives in a database. From there it can be queried in raw or aggregated form. We are currently persisting the data for a total of 6 months. This time span might change in the future and might be coupled to your license.
Configuration
Enrolling the Devices
The configuration that is necessary varies slightly between the different protocols. Before you can create a Sensor Configuration for your devices, you need to have them enrolled. For enrolling of BlueRange Devices, you can check our Enrollment chapter. For enrolling KNX or BACnet devices, you need to do some additional configuration steps mentioned in our guides on Configuring KNX and Configuring BACnet. Afterwards, you have a number of enrolled devices for each of your different subsystems.
Occupancy sensor
There is a dedicted configuration to enable a virtual occupancy sensor based on the motion sensor of a device. To enable it, you need a device, that reports motion and apply Occupancy management configuration.
The configuration consists of three parameters:
- threshold value
-
it defines the minimal value of the motion sensor value to be accepted. With this, you can filter out background noise.
- time slot
-
configured as duration, it defines the granularity in which the occupancy is generated.
- threshold exceedances
-
it defines the number of exceedances, a motion sensor value, of the threshold configured above, has to occur, so that the occupancy of the current time slot is set to
1(numerical representation oftrue).

- TIP
-
if there is no occupancy being reported by the system, please ask your Administrator to enable the occupancy feature for the server.
Viewing Live MQTT Data using MQTT Explorer
If your user has the required access rights, e.g. you are Administrator or Developer, you can see a live view of all the sensor data sent in your organization via MQTT by following our guide about creating and using an Access Token.

Viewing Sensor Data in the Portal
Our Portal currently only supports a predefined set of sensors to be displayed. We are working on a settings interface that will make this extendable. If you are running an on-premise installation of BlueRange, you can already extend the UI by providing a sensor-chart-configuration.json. Please contact use for more details.
Accumulated Statistics
For entities such as a Building, a Floor, a Room or others, we provide accumulated statistics of certain sensors. This will give you a quick overview for the current sensor values. You will find this data on the overview pages.

Statistics on a Floor / Room Level
Log in to our Portal and select either a floor or room. Next, select the Statistics tab. You will see an overview of all sensors that are available on this floor and you can see their current value and have an accumulated chart that shows you the history of sensor data.

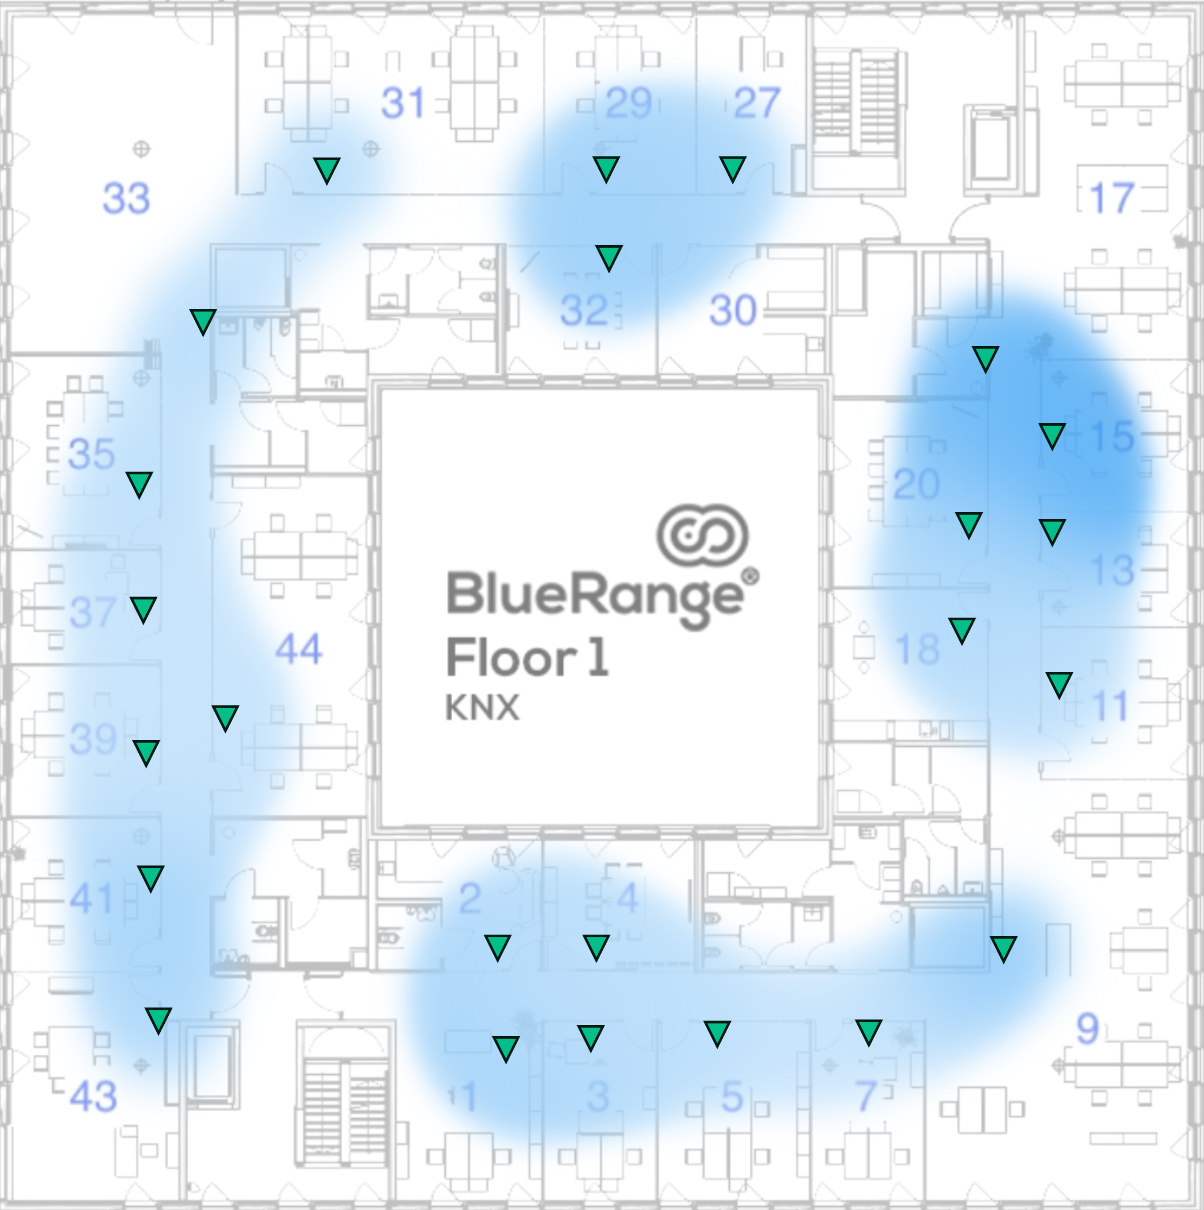
Sensor Map to Display Live Sensor Data
Our Sensor Map shows the current state of all sensors grouped by their type in a heatmap that is live-updating as soon as new sensor data is reported. Navigate to any floor with installed sensors and choose Sensor Map.
Sensor Data for a Network
On the network overview page, you will find a list of all reported sensor values and the devices that correctly reported these values. This list is updated as soon as new sensor data is arriving.

Sensor Data for Individual Devices
You can open any device that reports sensor data to see the current, min, max and historic values for all of the reported sensors.

The chart can be shown for the current day, week, month, year of for a custom time range. To select a custom time range, use the date selector.

After you selected a custom time range, you will get fine granular data for this time span if data has been recorded.
